By now you should be catching on with what these Carrot Lead Harvest Reports are all about. Each month we are committed to opening up our data and showing where the real estate investing leads on our platform are coming from. We love to be open and transparent, and hopefully, these numbers are as exciting to you as they are to us.
This is a great way for all of the Carrot community to keep a pulse on what is working and introduce new online marketing opportunities for real estate investors.
For InvestorCarrot members, use this as inspiration to know that what is at your fingertips with the InvestorCarrot platform, our training, and support is crushing it (in a good way) for our members… and it can for you too.
For non-Carrot members, use this as research to find out what’s working in today’s market… and get out there and implement!
A Few Quick Notes Before We Dive Into The Data
- What types of leads are they? The leads we are showing are motivated seller leads, cash buyers, rent to own tenants, note sellers and some private lenders mixed in there. The cash buyer, rent to own tenants and motivated sellers make up the bulk of the leads you will see.
- Do these leads include people who called on the phone? Nope, the numbers you will see on this page are ONLY leads where the seller, buyer, tenant, etc. put in their information into one of our InvestorCarrot member’s websites. Right now we can’t track phone call leads on member’s websites, but from our surveys and talking with customers that is likely another 5,000-8,000+ leads per month coming in from phone calls. But for the sake of this post, we’re only going to show what we can back up by data… and since we can’t currently track phone calls our customers receive… we’ll leave those leads out for now.
- What are leads that show up as “Direct” in the stats? Great question! Google started showing a huge chunk of traffic in Google Analytics as “Direct (none)” a while back. In the past, “direct” meant that the person actually put your URL into the browser and went to your website. But now, Google is mixing in a huge number of visitors that actually came from Google searches. Some studies show that 60%+ of the traffic that shows as “direct” is actually from Organic Google search. Google just does a good job of hiding that from us for some reason. So for the sake of this post, we’re going to say 60% of the “direct” lead source is actually SEO related.
Online Lead Generation: 16,568 Seller, Cash Buyer, Rent To Own & Tenant Leads Came In During September

If you are following our monthly harvest reports you will notice September’s leads were slightly less than last month. Whenever you study data like this, you must consider historical relevance to understand what the data is actually saying.
Summer Months Are Heavy Motivated Seller Months… fall and winter dip a bit historically. As a real estate investor, you are probably aware that leads tend to get a little harder to come by in the winter months. But the seasonality of leads shouldn’t deter you from ramping up your marketing efforts.
We expect to see this trend continue through the fall and holiday months… then come January we usually see a hefty increase for cash buyer leads because investors are looking at their goals for the year and start to seek out new investment opportunities.
What does this mean to you as an investor?
Make sure you know that there is seasonality to online searches and demand… and make sure you have other types of marketing to help stack on the leads during months that are traditionally slower “seller” months.
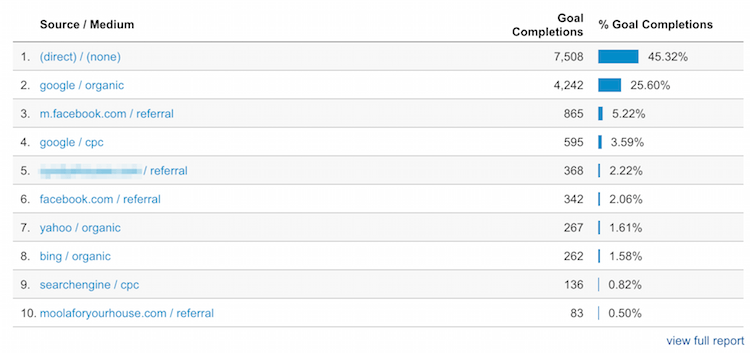
As we expected, the lead sources are in a similar order from last month
A majority of the leads coming to our customer sites are from direct traffic, which includes Craigslist ads, SEO, and people just typing in the URL of your website. No big surprises here.
Keep using those.
But, as we’ve seen in recent months again… Facebook (mobile) and Google Adwords continue to be amazing sources of leads. The Facebook leads tend to be cash buyers or rent to own tenants as motivated sellers are harder to attract through Facebook marketing (but not impossible).
Let’s look at the real estate investing leads by state
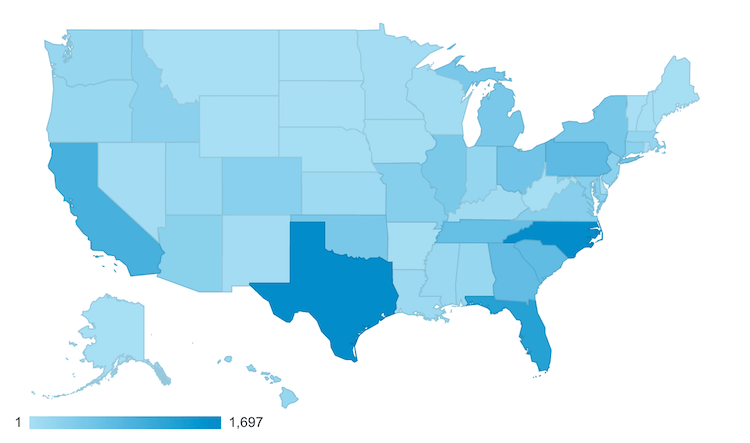
One statistic that we always find interesting is “goal completion” by state… in less nerdy terms… leads by state.
As you can see in the picture below, the darker the blue color… the more leads were generated by our members in those states in September.
Real Estate Investing Leads By State For September

Now, remember, these are all types of leads. Sellers, cash buyers, rent to own tenant buyers, private lenders, etc.
There are lots of ways you can interpret this… but here’s what we see from it.
The “early mover” markets like Florida, Arizona, and California are hot right now. Many sellers are jumping into the fray wanting to sell their houses and there are a lot of investors looking to buy properties in these markets. But then you see states that have more consistently strong real estate markets that are also pulling in solid leads. Like Texas, North Carolina, Pennsylvania, Colorado, Georgia, and many many more.
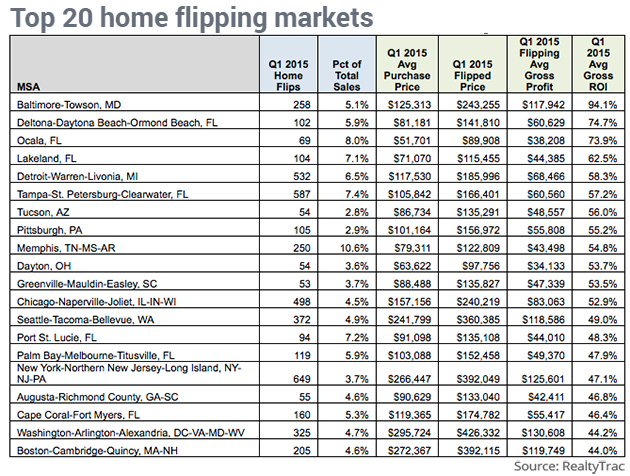
If we compare this against the top real estate markets to flip houses in the US in 2015 (below) you’ll see that some of this data matches up quite nicely. Also, you’ll see that in many states in our chart above that aren’t a dark blue… they are still insanely great markets to flip houses in right now. So use both our chart above with the chart below to really target in on hot flipping markets right now.

Fun Fact: 20% of last months leads came in on a Tuesday
This isn’t groundbreaking or Earth-shattering data, but it is pretty darn cool nonetheless.
We can drill down in our Google Analytics and see which day generates the most leads for our members.
What should you do with this data?
Well, you can use it to tweak some ads or be more active on social media during these times.
Try tuning your Adwords, or Facebook marketing to use more of your budget on a Tuesday and see if you can’t get a boost in leads. Also, make time to be on Twitter looking at trending topics or ways to engage with sellers and buyers on forums and Facebook discussions.
Google Analytics makes Sunday 0, so 1 would be Monday and so on.
Day Of The Week Leads Come In

As interesting as the #1 day that leads are attracted online according to our data… is also the times that the least leads come in… the weekend.
Notice that Saturday was the worse in September, Sunday 2nd worse, and Friday 3rd worse. With the middle of the week coming in on top.
What does this mean? It gives a bit of a glimpse into the way motivated sellers, tenants, and cash buyers search. They tend to want to forget about their real estate issue on the weekends… and come mid week are reminded that they really need to get their butt in gear and make stuff happen.
So leverage this data by bumping up the activity on your social media marketing during mid-week and maybe even making sure your direct mail pieces land in their inbox mid week (test it).
How Is Your Online Lead Generation Going For Your Real Estate Investing Business?
If you’re interested in leveraging our Inbound Online Marketing platform at InvestorCarrot, our training, and our support team, take a demo or checkout our plans.
Over the coming months, we’re developing new PPC landing pages (we’re actually testing them on PPC campaigns right now), new SEO tools to help you more effectively rank in Google, and beefing up our Customer Success team to help investors… from beginners to the most advanced… leverage the web in a more effective way.