Your site can look like a Carrot site.
It won’t perform like one.
Every detail on your website either earns you deals or loses them. We’ve spent 10+ years and millions of leads figuring out which is which.
What drives rankings, conversions, and closed deals isn’t what you can see — it’s the architecture underneath. Built from thousands of split tests, refined by data no other platform has, and engineered by the team that created the playbook everyone else follows.
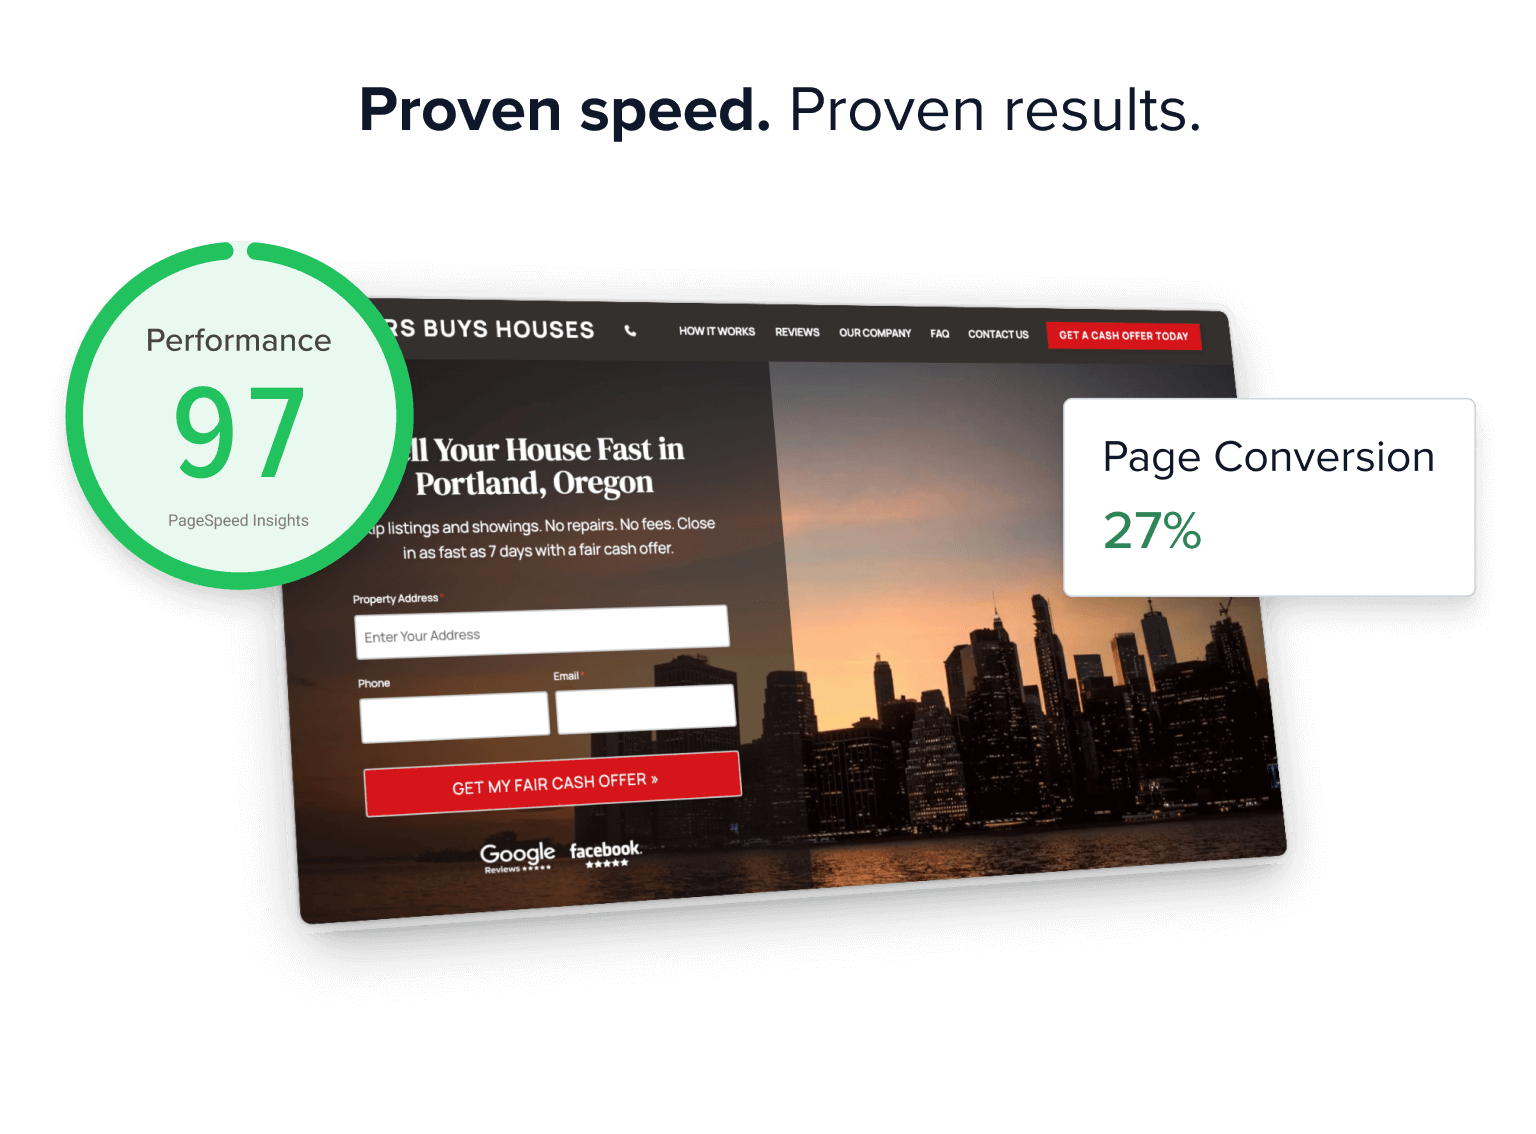
98+
PAGESPEED
30-50%
OF TOP GOOGLE RANKINGS
10+ YEARS OF CONVERSION DATA
The performance gap isn’t visible.
That’s what makes it expensive.
When someone builds a site that “looks like Carrot,” they’re copying the 20% you can see. The 80% that actually drives your rankings, conversions, and revenue? That’s invisible. And it’s the difference between a site that looks good and a site that closes deals.
Above the Surface — What You Can See
- Mobile-friendly appearance
- Clean design and layout
- Contact forms and calls to action
- Content on the page
Below the Surface — What Actually Drives Results
- Page speed architecture engineered to 98+ scores (not bolted on after the fact)
- Conversion-tested layouts refined across thousands of sites & millions of leads
- Schema markup and structured data tuned for Google and AI search
- Heading hierarchy, internal linking, and crawl structure built for how search engines rank pages
- CTA placement, color, size, and language tested through years of split tests — not best guesses or gut feelings
- Image compression, lazy loading, code minification, and server response times optimized at the platform level
- Content structures proven to convert local search visitors
- Behind-the-scenes updates as Google, mobile devices, and AI search evolve
This isn’t marketing. It’s methodology.
Every high-performing Carrot site is built on four pillars we’ve developed, tested, and refined since 2013. These aren’t theories. They’re the result of real data from real businesses closing real deals. This is what separates a site that looks good from a site that performs. And it’s why copying the surface will never close the gap.
Pillar 1: Conversion Science
Zero guesswork.
We don’t guess where your CTA should go. We’ve tested it.
- Button color, size, placement
- Headline length and language
- Form fields — how many, what order, what labels
- Page layout & section sequence
- Even the specific words on a submit button
We’ve run tests across thousands of sites, generating millions of leads. Every default in your Carrot site exists because the data said it converts better than the alternative.
When Carrot builds you a site, we’re using a decade of proof.
Pillar 2: Speed
PageSpeed isn’t a feature. It’s a foundation.
Most platforms treat speed as an afterthought. Build the site first, optimize later.
We engineered speed into the platform itself. Carrot sites score 98+ desktop/90+ mobile out of the box — no plugins, no manual optimization, no crossing your fingers.
This matters more than most people realize. For every 1 second your site loads slower than 2.5 seconds, conversion drops by 0.5%.
A typical WordPress site loading at 8.5 seconds? That’s a 3% conversion penalty. On 1,000 visitors, that’s 30 lost leads. At $20K per deal, that’s $20K-$60K in revenue gone.
Carrot sites load 60% faster than custom WordPress. That speed gap is a revenue gap.
Pillar 3: Proprietary Data
Millions of local search leads. One unfair advantage.
Carrot sites hold 30-50% of top Google rankings for motivated seller keywords. No other platform has ever achieved that kind of dominance in a competitive niche.
It didn’t happen by accident.
We’ve collected and analyzed data from millions of local search leads across thousands of sites for over a decade. Which content structures rank. Which page formats convert. Which keyword patterns drive motivated leads vs. tire-kickers.
That data feeds everything — our AI tools, our default site structures, our SEO recommendations, our conversion optimization. It’s a compounding advantage that gets stronger every year.
Pillar 4: Continuous Innovation
Your site gets better while you sleep.
A custom site is at its best the day it launches. On day 2, it starts degrading.
Google algorithms change. AI search reshapes how people find businesses. Page speed standards tighten. New conversion patterns emerge.
With a custom site, every shifts is your problem to solve.
With Carrot, we make regular platform-wide updates. Speed optimizations. Schema updates for AI search visibility. Conversion improvements based on new data. Security patches. Mobile refinements.
You wake up and your site is faster, more visible, and converting better than it was last month. You didn’t do anything. We did it for you.
10+ years of firsts.
Most of what the real estate investing industry considers “standard” for websites and online marketing? We invented it.
Then we kept going.
2013
Founded with one bet
While every website company competed on design templates, we bet everything on performance. Sites that rank. Sites that convert. That bet became an industry.
2014
Pioneered the motivated seller website
We created the high-converting website framework for real estate investors that didn’t exist before Carrot. The page structures, content flow, and conversion elements that are now everywhere? They started here.
2015
First to build SEO into the platform
While competitors sold “just a website,” we integrated SEO tools directly into the product. Keyword tracking, on-page optimization, search visibility — built in, not bolted on.
2016
Cracked the local search code at scale
Carrot sites began dominating Google rankings in market after market. Not one city. Not one keyword. Thousands of sites ranking for thousands of local terms — the beginning of the 30-50% market share that no one’s touched since.
2017
First to offer live chat support in the industry
Sounds small. It wasn’t. When every competitor made you submit a ticket and wait, we put real humans on live chat because our customers’ time matters.
2020
Split testing at platform scale
We moved beyond site-level testing into platform-wide conversion optimization. When we found a winner across thousands of sites, every Carrot customer benefited automatically.
2022
Acquired InvestorFuse.
Added world-class CRM capabilities purpose-built for inbound marketers to the Carrot ecosystem. Not another outbound dialer — a system designed for the leads our sites were already generating.
2024
Launched CarrotCRM with AI Suite
AI-powered lead intelligence. Opportunity summaries in 30 seconds. AI lead follow-up that sounds human. A CRM reimagined for how local businesses actually work.
2025-2026
New platform. AI-generated sites. Speed dominance reclaimed.
Completely rebuilt the Carrot platform with far more design flexibility, drag-and-drop editing, and AI-generated websites with fully unique content for every business. 98+ PageSpeed scores across the board.
What’s next?
AI search optimization. Support for local service busineses outside of real estate. Agency-scale management tools. The playbook keeps getting written — and we’re still the ones writing it.
When someone tells you their site is “just as good as Carrot,” ask them one question.
Where’s their decade of data?
Numbers don’t have opinions.
Claims are easy. Every platform says they’re fast, high-converting, and great for SEO. Here are the real numbers.
Page Speed Performance
98+ desktop. 90+ mobile. Out of the box.
No plugins to configure. No developer to hire. No optimization checklist to work through. Every Carrot site launches at these scores automatically.
To hammer home how impressive this is, here are average speed scores for other common website builders
| Carrot | Custom WordPress | GoHighLevel | Wix / Cheap Builders | |
|---|---|---|---|---|
| Desktop Speed | 98+ | 40-65 | 50-70 | 55-75 |
| Mobile Speed | 90+ | 30-55 | 40-60 | 45-65 |
| Optimization Required | None | Extensive | Moderate | Limited options |
True cost of speed
2 seconds = $20k
Here’s the math most platforms hope you never see.
For every 1 second your site loads slower than 2.5 seconds, conversion drops by 0.5%. Doesn’t sound like much, but when you do the math … it adds up to real revenue.
And that’s just from speed — before you factor in layout, CTA placement, content structure, or any of the other conversion elements we’ve spent 10+ years testing.
| Site Load Time | Speed Penalty | Conversion Loss | Lost Leads / 1,000 Visitors | Revenue Impact ($20K/deal) |
|---|---|---|---|---|
| 2.5 sec (Carrot) | 0 sec | 0% | 0 | $0 |
| 4.5 sec | 2 sec | -1% | 10 leads | $20K-$40K |
| 6.5 sec | 4 sec | -2% | 20 leads | $40K-$80K |
| 8.5 sec (typical WP) | 6 sec | -3% | 30 leads | $60K-$120K |
What performance looks like in the real world

Jeremy Resmer
$1M+ in assignment fees from SEO in 2025 from his Carrot site.

Dan Beaulieu
#1 in his market for 7 years straight. Total monthly marketing cost: $200.

Top PPC Performers
35-37% visitor-to-lead conversion on paid traffic. Not counting phone calls.
How many critical site elements are you missing?
Your agency or site builder probably showed you a nice design and told you it was “optimized.” But optimized for what? And based on what data? Here’s a quick gut check. These are the things we’ve proven — through millions of leads — actually move the needle on rankings, conversions, and revenue. Most sites miss more than half of them.
Speed & Technical Foundation
- Does your site score 98+ desktop and 90+ mobile on Google PageSpeed?
- Is your server response time under 200ms?
- Are your images automatically compressed and lazy-loaded at the platform level?
- Is your code minified and optimized without relying on third-party plugins?
- Is your site getting faster over time — or slowly decaying as technology changes?
Conversion Architecture
- Has your CTA button text been split tested against alternatives — or did someone just pick what sounded good?
- Has your form field count been tested to find the line between lead volume and lead quality?
- Is your page section order based on data — or on what the designer thought looked nice?
- Are your above-the-fold elements proven to reduce bounce rate for local search visitors specifically?
- Is your site converting at 6%+ on organic traffic?
SEO Structure
- Is your heading hierarchy built for how search engines actually crawl and rank pages — not just for visual formatting?
- Does your site have schema markup tuned for Google and AI search visibility?
- Is your internal linking structure intentional and optimized for crawl depth?
- Is your content structured for local search intent — not generic national SEO patterns?
- Is your site being updated behind the scenes as Google’s ranking criteria evolve?
Data & Intelligence
- Is your site layout based on conversion data from millions of leads in your industry — or from general “best practices”?
- Do you know which content structures drive motivated leads vs. tire-kickers in your specific market?
- Is your platform learning and improving from aggregate performance data across thousands of sites?
- Are platform-wide improvements automatically applied to your site — or do you have to request and pay for every update?
If you checked 15+: You’re in rare company. Your platform is doing serious work under the hood.
If you checked 8-14: You’ve got a decent site with real gaps. Those gaps are quietly costing you leads and deals every month.
If you checked fewer than 8: Your site looks like a website. It’s not performing like one. Every month it stays this way, you’re funding your competitors’ growth with the leads you’re losing.
Most custom sites check 3-5 of these boxes. Most all-in-one platforms check 4-7. Most cheap builders check 1-3.
Carrot checks all of them. Out of the box. On day one.
Not because we’re trying to win a features competition. Because we’ve spent 13 years learning — through data, not opinions — that every single one of these items impacts whether a visitor becomes a lead or bounces to your competitor.
Your website isn’t a brochure.
It’s your highest-leverage sales tool.
Every visitor who lands on your site is making a decision — contact you or click back to your competitor. The invisible details on this page are what tip that decision in your favor.
It’s time to stop betting on a platform that doesn’t work.